


Most travel agency software decisions die in one of two ways. Either the deal gets approved on gut feel and then nobody can prove it worked twelve months later, or finance kills it because the business case was a vendor-supplied slide deck full of "up to 40% time savings" claims that don't hold up for five minutes.
Both failures come from the same root cause: nobody built a defensible baseline before they started shopping. This guide fixes that. It's built for the person who has to stand in front of a CFO and defend the number — not the person who wants to feel good about buying new software.
We're going to build a travel management software ROI case the way a skeptical finance team would want it built: measured baselines first, conservative uplift modeling second, vendor pricing translated into apples-to-apples terms third, and a sign-off gate that forces accountability after the purchase.
Start with the executive summary — and write it last
The summary goes at the top of your deck, but you write it after everything else is modeled. CFOs read this first and decide in about 90 seconds whether to keep reading. Here's a template that works:
> Recommendation: Purchase [vendor] at an annual cost of roughly $[X], replacing [current tools/manual process]. > > Measured baseline: Our team currently spends ~[hours/week] on [activity], at a fully-loaded cost of ~$[Y]. Error/rework rate is ~[Z]%. > > Modeled annual benefit (likely case): ~$[A] in recovered labor + ~$[B] in reduced leakage/errors = ~$[total]. > > Payback period: ~[N] months. Net 3-year value: ~$[figure]. > > Risk: Benefits are attributed to [single vendor / phased rollout]. Primary sensitivity is [adoption rate / booking volume]. > > Ask: Approval to sign a [12/24]-month contract with [specific commercial protections].
Step 1: Collect your baseline data (the part everyone skips)
You cannot model ROI on a process you haven't measured. The single biggest reason post-purchase ROI claims fall apart is that there was never a real "before" number — just a vibe that things were slow.
Eliminate booking chaos and streamline operations.
Travexly helps you manage, confirm, and track travel bookings effortlessly.
- Unified booking management
- Automated client communications
- Team scheduling & itinerary tracking
No credit card required
What you actually need to measure, and where to pull it from:
| Metric to capture | Where it lives | How to pull it |
|---|---|---|
| Hours per booking (by booking type) | Time logs, calendar, agent self-report | 2-week time sample, averaged |
| Monthly booking volume | GDS/booking tool exports, invoices | Count by type (FIT, group, corporate) |
| Rework / amendment rate | Email threads, amendment logs | % of bookings touched >2x after confirmation |
| Commission leakage | Accounting/reconciliation reports | Unreconciled or short-paid commissions ÷ expected |
| Fully-loaded labor cost | Payroll | Salary + ~25–30% for benefits/overhead |
| Response-to-enquiry time | CRM / inbox timestamps | Median hours from enquiry to first quote |
| Tool/license spend (current) | AP, subscription list | Sum of all current software being replaced |
| Error-related refunds/goodwill | Finance ledger, dispute log | Annual total of agent-error compensation |
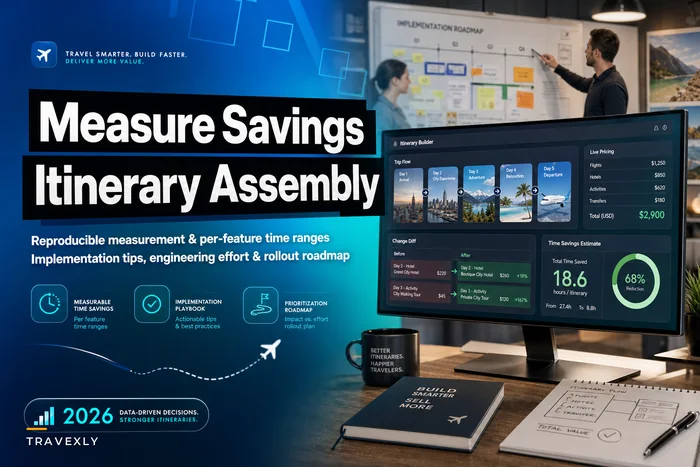
A two-week time sample beats a one-time guess every time. When agents estimate how long itinerary assembly takes, they almost always undercount — they forget the back-and-forth, the supplier follow-ups, the re-quotes. If you want a structured way to estimate those time buckets before you sample, the breakdown in feature-by-feature time-savings for itinerary assembly gives you realistic ranges to sanity-check against.
> Sidebar — Dealing with incomplete data > Most agencies don't have clean logs. That's fine. Pick a representative sample rather than chasing a full-year dataset. Measure your three busiest agents over two weeks, extrapolate, and clearly label the extrapolation in your model. The mistake isn't using estimates — it's hiding that you used them. Finance will trust a labeled assumption far more than a suspiciously precise number with no source.
Step 2: The 8 priority KPIs (with definitions and how to measure them)
Pick eight. More than that and your model becomes noise; fewer and you miss the leakage categories that actually move money. These are the ones that consistently matter for a travel management software ROI case.
-
Agent hours per booking — Total productive hours ÷ bookings completed, split by type. Query: time-sample total ÷ booking count.
-
Cost per booking (fully loaded) — (Agent hours per booking × loaded hourly rate) + allocated tool cost. This is your headline efficiency number.
-
Amendment/rework rate — Bookings requiring post-confirmation changes ÷ total bookings. High rework is where soft costs hide.
-
Enquiry-to-quote time — Median hours between enquiry and first quote. Directly tied to conversion.
-
Quote-to-book conversion — Confirmed bookings ÷ quotes sent.
-
Commission capture rate — Commission actually collected ÷ commission owed. A leak here often dwarfs labor savings.
-
Error-related cost — Annual refunds, goodwill, and comp attributable to agent/process error.
-
Reconciliation effort — Hours per month spent matching supplier invoices to bookings and payments.
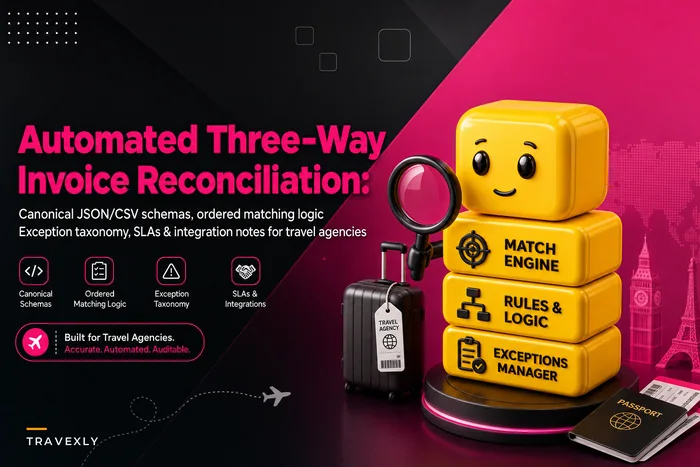
That last one is routinely underestimated. The manual three-way match between booking, supplier invoice, and payment eats a surprising number of finance hours — the canonical approach to automating it is covered in this breakdown of automated three-way invoice reconciliation, which is worth reading before you estimate how much of that time a new platform could realistically recover.
Map your ROI KPIs to existing action-trigger thresholds so you're not maintaining two scorecards.
A note on KPI overlap: if you already track action-trigger thresholds for these metrics, map your ROI KPIs to those so you're not maintaining two scorecards. One set of numbers everyone trusts — that's the goal.
Step 3: Model three uplift scenarios — don't pick one
The fastest way to lose a finance team's trust is to present a single optimistic number. Present three. It signals you understand the uncertainty, and it gives the CFO a range to anchor on.
Here's a worked example for a mid-size agency doing roughly 330 bookings a month, with around 4 agents at a loaded rate of about $38/hour, currently averaging ~2.1 hours per booking.
Baseline annual labor on booking assembly: ~330 × 12 × 2.1 × $38 ≈ $316k
| Scenario | Time saved/booking | New hrs/booking | Annual labor saved | Leakage recovered | Total annual benefit |
|---|---|---|---|---|---|
| Conservative | 15% | ~1.79 | ~$47k | ~$6k | ~$53k |
| Likely | 28% | ~1.51 | ~$89k | ~$14k | ~$103k |
| Aggressive | 40% | ~1.26 | ~$126k | ~$22k | ~$148k |
The modeling assumptions you must state explicitly:
-
Time savings don't convert to cash automatically. Saving 28% of agent time only becomes money if you either reduce headcount, redeploy those hours to revenue work, or absorb growth without hiring. Say which one you mean. A CFO will ask.
-
Leakage recovery is separate from labor. Commission capture and error reduction are real dollars, not redeployed time — they're more defensible, so weight them heavily in your conservative case.
-
Adoption ramps. Nobody hits "likely" in month one. Model a ramp: maybe 40% of the benefit in quarter one, full run-rate by month six.
> Sidebar — Attributing benefits: single-vendor vs phased > If you're buying one platform that replaces several tools, attribution is clean — the benefit is whatever changed after cutover. If you're rolling out in phases (itinerary tools first, reconciliation later), attribute benefits phase by phase and hold a control. The common mistake is crediting the new software for improvements that actually came from a process change you made at the same time. Phase your rollout so each change has a clean before/after window.
Visualize the modeling workflow:
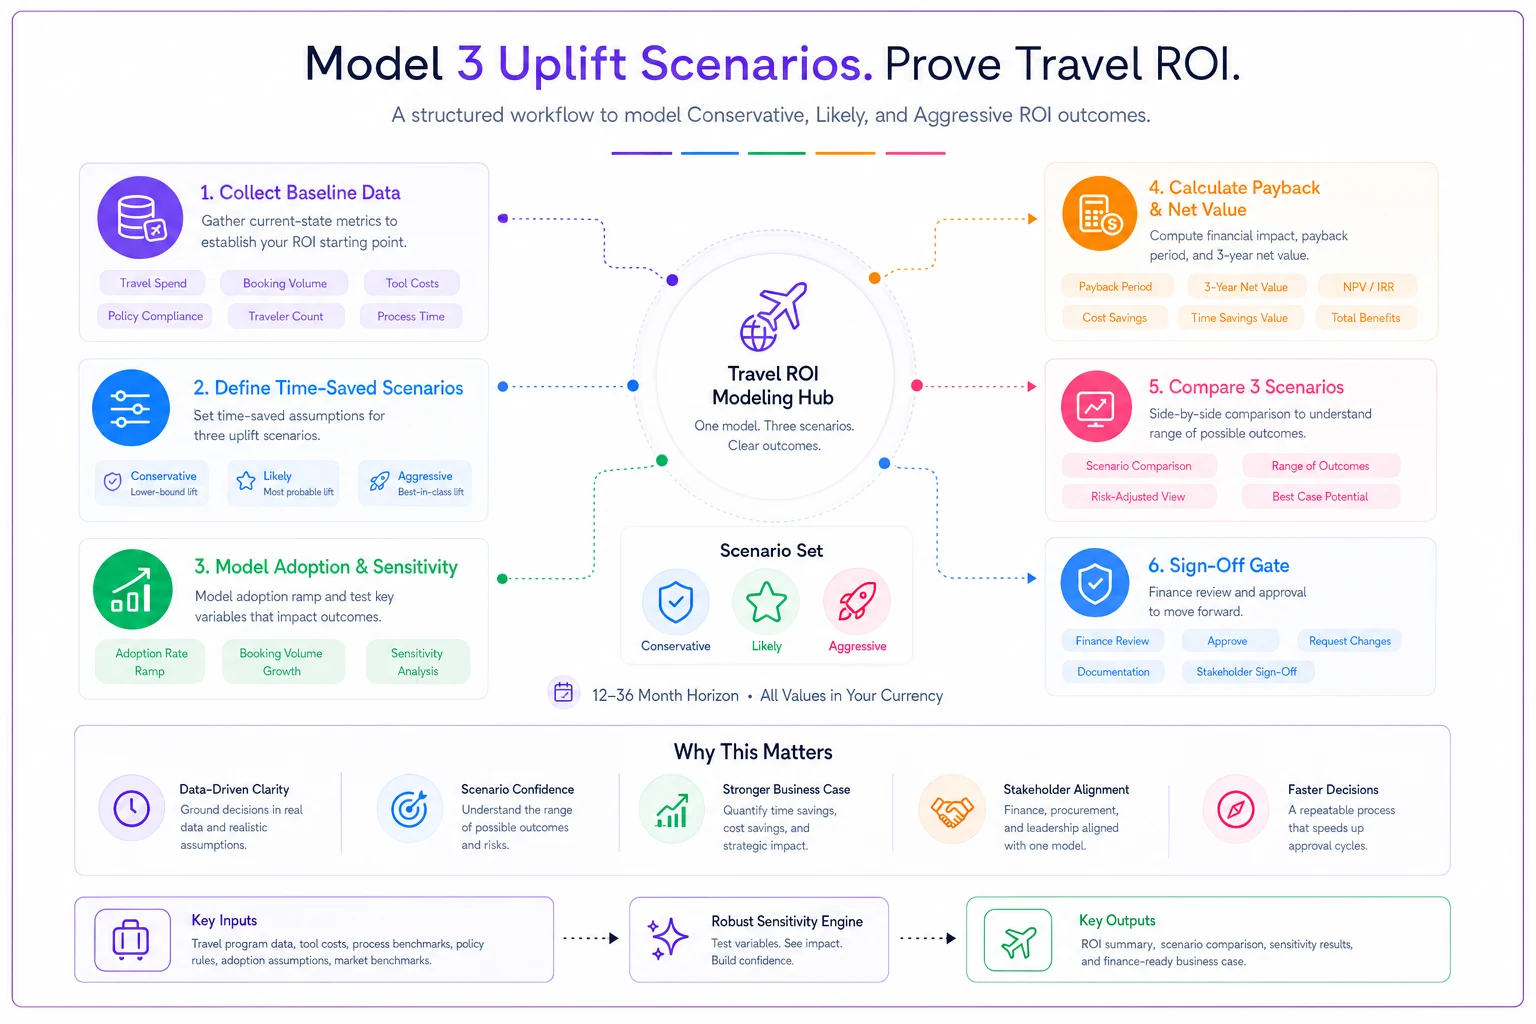
Use this to present the three scenarios alongside an adoption ramp and sensitivity tests to your CFO.
Step 4: Translate vendor pricing into one comparable number
Vendors price in deliberately non-comparable ways. Your job is to normalize everything into cost per booking per year so three quotes can sit on the same line.
| Pricing model | What you're charged | Hidden gotcha | Normalize by |
|---|---|---|---|
| Per-seat SaaS | Fixed fee × licensed users | Paying for seats during slow season | Divide annual cost ÷ annual bookings |
| Per-booking | Fee each transaction | Scales painfully in peak season | Multiply fee × projected annual volume |
| Transaction % | % of booking value | Punishes high-value luxury bookings | Model against your actual AOV mix |
| Hybrid | Base + per-booking overage | Overage tiers buried in the contract | Model at your 90th-percentile month |
Run every quote through your projected volume, not last year's. If you expect to grow, per-booking and transaction-fee models can quietly erase your ROI in year two. A per-seat model with room to grow bookings often wins on a three-year view even if it looks pricier in month one.
> Sidebar — Negotiating terms that protect measured ROI > Your ROI model assumes certain pricing and performance. Protect that in the contract: > - Price locks on renewal (cap increases at a fixed %). > - Volume bands so a good year doesn't trigger a fee cliff. > - Data portability in writing — you must be able to export your booking history if you leave. > - A short initial term or exit clause tied to adoption milestones. If the platform isn't live and adopted by month four, you want an off-ramp. > > Never sign a multi-year deal priced on a volume you haven't hit yet without a band that protects you both directions.
Step 5: Payback thresholds and sensitivity analysis
Set the bar before you see the vendor's number, so you're not rationalizing a bad deal after the fact.
-
Payback under 9 months strong, approve.
-
9–15 months acceptable if leakage recovery is well-evidenced.
-
Over 18 months only if it's a platform play enabling growth you couldn't otherwise handle.
Then stress-test the one variable that breaks everything. For most agencies that's adoption rate, not price. Show what happens if only 60% of the modeled time savings materialize.
In the example above, the likely case ($103k benefit) against a ~$36k annual platform cost gives a payback of roughly 4–5 months. Drop benefit realization to 60% and you're at ~$62k benefit — payback still lands under 8 months. That's a model that survives a bad adoption quarter, which is exactly what you want to show a skeptical CFO.
Run the same sensitivity on booking volume if you chose a per-booking vendor. If a 20% volume increase pushes your fees past your labor savings, that's a contract problem you fix now, not later.
A real scenario
A seven-person leisure agency was running itinerary assembly across spreadsheets, email, and a GDS, with reconciliation done manually at month-end. Baseline: about 290 bookings/month, ~2.3 hours per booking, and finance spending roughly 22 hours a month matching supplier invoices. Commission capture was sitting around 91% — meaning close to 9% of owed commission was quietly going uncollected.
They built the case before shopping. Baseline labor on assembly came to roughly $280k/year. Commission leakage was worth somewhere around $18k–$24k annually depending on the month. They modeled a conservative 18% time saving and assumed they'd recover about two-thirds of the commission gap.
Twelve months after rollout, assembly time landed around 1.9 hours per booking — a bit short of the likely case — and commission capture climbed to about 96%. They didn't cut headcount. They absorbed a ~15% booking increase without hiring, which is how the time savings became real money. Payback came in just over six months. The reason they could prove it: the baseline existed first.
The stakeholder sign-off and implementation gate
ROI cases that skip governance tend to drift. The project ships, nobody owns the number, and twelve months later there's no accountability. Use a hard gate.
Pre-purchase sign-off checklist:
-
[ ] Baseline data collected and dated (not estimated without labels)
-
[ ] Three uplift scenarios modeled with stated assumptions
-
[ ] Vendor quotes normalized to cost-per-booking-per-year
-
[ ] Payback threshold agreed by finance before vendor selection
-
[ ] Sensitivity run on the one variable that breaks the model
-
[ ] Commercial protections (price lock, volume band, exit clause) confirmed in contract
-
[ ] A single owner named for the post-go-live ROI review
-
[ ] Rollout phased so each benefit has a clean before/after window
Implementation gating:
-
Gate 1 — Contract signed only after all pre-purchase boxes are checked.
-
Gate 2 — Go-live only after data migration is validated and a pilot team is trained.
-
Gate 3 — Adoption check at 90 days. Measure actual hours-per-booking against your model. If you're below 50% of projected benefit, trigger the vendor support clause.
-
Gate 4 — ROI review at 12 months. Re-pull the eight KPIs. Compare to baseline. This is the number that justifies renewal.
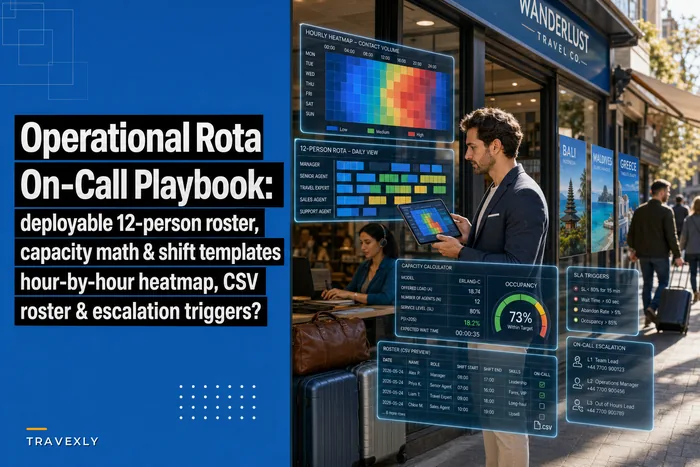
Staffing matters for gates 2 and 3 — if your busiest agents are also the ones expected to learn the new platform during peak season, adoption stalls and your model looks wrong for reasons that have nothing to do with the software. Planning rollout around realistic capacity is covered in the operational rota and on-call playbook, which is worth checking before you commit to a go-live date.
When this makes sense — and when it doesn't
Build this full case when: you're spending real money (replacing multiple tools, committing to a multi-year contract), or when finance has previously rejected a software ask. The rigor is the point.
When it's overkill: a sub-$200/month tool with a monthly cancellation option doesn't need a three-scenario sensitivity model. Just pilot it. The modeling effort should scale with the commitment.
Who should not do this: if you genuinely can't collect even a two-week time sample — no logs, no cooperation, no way to measure the baseline — don't fabricate one to force a case through. Fix your measurement first. A travel management software ROI model built on invented baselines is worse than no model, because it looks defensible right up until the 12-month review proves it wasn't.
The thing most people get wrong
The number isn't the deliverable. The traceability is. A CFO doesn't approve software because the ROI looks big — they approve it because every figure in your deck connects back to a source they could verify if they wanted to, and because you told them what would break the model before they had to ask.
Build the baseline first. Model a range, not a wish. Normalize the pricing so vendors compete on the same axis. Protect the number in the contract, and name someone to defend it at twelve months. Do that, and the purchase decision mostly makes itself — and far more importantly, you'll actually know whether it worked.
Build the baseline first. Model a range, not a wish. Normalize the pricing so vendors compete on the same axis. Protect the number in the contract, and name someone to defend it at twelve months. Do that, and the purchase decision mostly makes itself — and far more importantly, you'll actually know whether it worked.
Ready to elevate your travel agency workflow?
Join 1,200+ travel agencies using Travexly to save time, improve client satisfaction, and boost operational efficiency.