
Most travel agency dashboards look impressive but trigger zero operational changes. Rows of metrics, colorful charts, conversion rates down to three decimal places—meanwhile, the owner checks it once a month and makes decisions based on gut feeling anyway.
The problem isn't tracking too few metrics. It's tracking metrics without clear action triggers.
A travel consultant I worked with in Phoenix tracked 31 different KPIs across three different systems. She spent hours each week updating spreadsheets. When I asked her what she did when her booking conversion rate dropped from 18% to 15%, she said "I just try harder next month."
That's not a KPI problem. That's an operational clarity problem.
Why most travel agency KPIs fail to drive action
KPIs without thresholds are just numbers on a screen. You need specific trigger points that tell you exactly when to intervene and what to do.
An agency owner tracks average booking value religiously. It hovers around $3,400 for months. One month it drops to $3,100. They notice, feel concerned, then... nothing changes. Next month it's $2,900. Still nothing. By the time they actually adjust their sales process or supplier mix, they've leaked thousands in potential revenue.
The agencies that maintain healthy margins don't just track metrics—they have predetermined response protocols. When average booking value drops below $3,200, they immediately review their last 20 quotes. Below $3,000? They schedule supplier renegotiations that week.
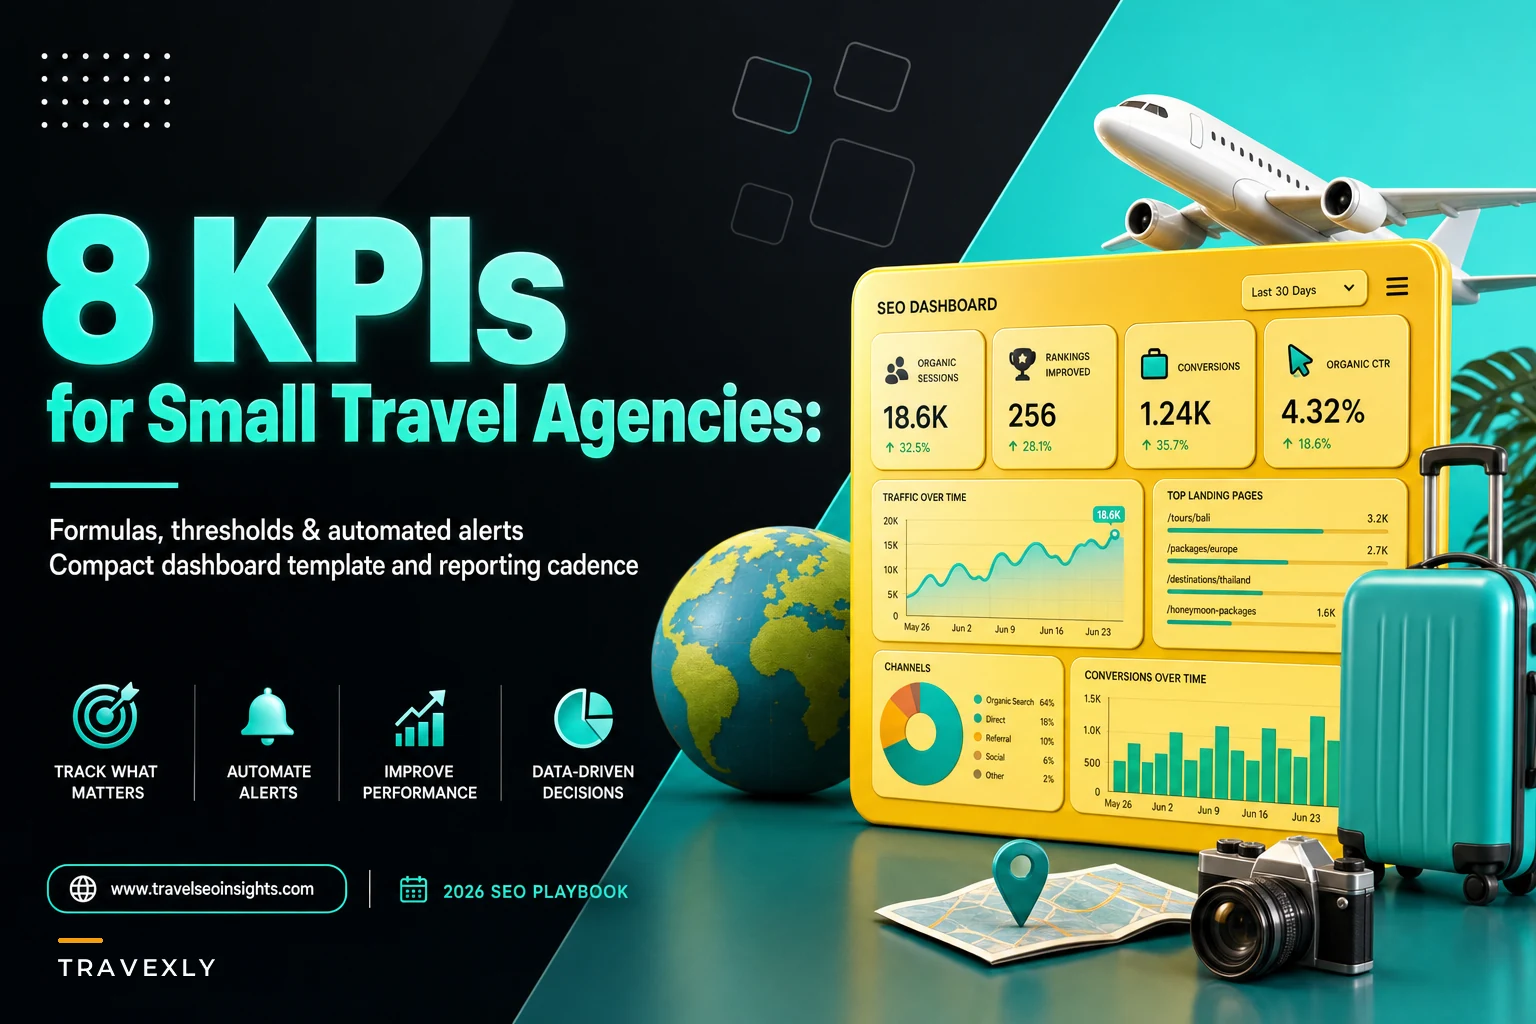
The 8 KPIs that actually matter (with exact formulas)
After analyzing operational data from dozens of small travel agencies, these eight metrics consistently predict financial health and operational efficiency:
Eliminate booking chaos and streamline operations.
Travexly helps you manage, confirm, and track travel bookings effortlessly.
- Unified booking management
- Automated client communications
- Team scheduling & itinerary tracking
No credit card required
1. Quote-to-Booking Conversion Rate
Formula: (Bookings Confirmed / Quotes Sent) × 100
-
Above 25%
Maintain current process
-
20-25%
Review quote follow-up timing
-
15-20%
Audit quote quality and pricing
-
Below 15%
Immediate sales process overhaul
A solo advisor in Austin discovered her conversion rate had slowly declined from 22% to 14% over six months. She'd been too busy servicing existing bookings to notice. One systematic review of her quotes revealed she'd stopped including specific client preferences in proposals—she'd gotten lazy with templates. Two weeks after personalizing quotes again, conversion jumped back to 19%.
2. Average Booking Value (ABV)
Formula: Total Booking Revenue / Number of Bookings
-
Above target
Push for add-ons and upgrades
-
10% below target
Review supplier commissions
-
15% below target
Adjust client targeting
-
20% below target
Restructure service offerings
Track this monthly but analyze it weekly. Small agencies often see ABV drift lower as they get comfortable with easier, lower-value bookings.
3. Days to Payment Collection
Formula: Average days between booking confirmation and final payment received
-
Under 30 days
Optimal
-
30-45 days
Tighten payment terms
-
45-60 days
Implement payment reminders
-
Over 60 days
Review credit card processing and payment plans
One agency owner discovered she was floating nearly $47,000 in unpaid bookings at any given time. Not because clients wouldn't pay—she just wasn't asking consistently. Adding automated payment reminders cut her collection time from 52 to 28 days, improving cash flow dramatically.
4. Supplier Commission Recovery Rate
Formula: (Commissions Received / Commissions Expected) × 100
-
Above 98%
Excellent supplier management
-
95-98%
Minor tracking improvements needed
-
90-95%
Commission reconciliation process needed
-
Below 90%
Urgent supplier audit required
This metric catches money left on the table. A boutique agency in Denver thought they had 100% commission recovery until they actually tracked it. Reality: 91%. They were missing roughly $2,400 monthly in commissions that suppliers "forgot" to pay or calculated incorrectly.
5. Client Acquisition Cost (CAC)
Formula: Total Marketing & Sales Costs / New Clients Acquired
-
Below 15% of ABV
Scale marketing
-
15-25% of ABV
Maintain current spend
-
25-35% of ABV
Optimize marketing channels
-
Above 35% of ABV
Halt paid acquisition
Include everything: ads, networking events, CRM costs, your time at $75/hour. Most agencies undercount their true CAC by excluding owner time.
6. Booking Error Rate
Formula: (Bookings with Errors / Total Bookings) × 100
-
Below 2%
Acceptable
-
2-4%
Process documentation needed
-
4-6%
Immediate workflow review
-
Above 6%
Full operational audit
Errors include wrong dates, misspelled names, incorrect pricing, missed preferences—anything requiring correction after confirmation. Each error costs roughly 45 minutes to fix and damages client confidence.
7. Revenue Per Available Hour (RevPAH)
Formula: Total Revenue / Total Working Hours
-
Above $200/hour
Highly efficient
-
$150-200/hour
Good efficiency
-
$100-150/hour
Optimization needed
-
Below $100/hour
Urgent efficiency review
This tells you if you're working on the right things. A travel advisor tracking this realized she spent 12 hours weekly on $800 bookings while rushing through $4,000 bookings in 2 hours. She restructured her time allocation and increased RevPAH from $115 to $165 within a month.
8. Active Client Repeat Rate
Formula: (Clients who booked again within 18 months / Total clients from 18 months ago) × 100
-
Above 40%
Excellent retention
-
30-40%
Good, maintain touchpoints
-
20-30%
Increase follow-up frequency
-
Below 20%
Client experience overhaul needed
Not yearly—18 months captures actual travel patterns better. Leisure travelers don't always book annually.
Building your travel agency KPI dashboard (copy this layout)
Here's a dashboard structure that actually drives daily decisions:
| Section | Metrics | Update Frequency |
|---|---|---|
| Weekly Snapshot | Quote-to-Booking Conversion, Average Booking Value, Booking Error Count | Daily review |
| Monthly Trends | Days to Payment Collection, Client Acquisition Cost, Supplier Commission Recovery Rate | Weekly analysis |
| Quarterly Health Check | Active Client Repeat Rate | Monthly monitoring |
Mount the dashboard where the team can see it all day so threshold breaks get noticed immediately.
Place the dashboard somewhere you'll see it daily. Not in a folder. Not three clicks deep in your CRM. Make it your browser homepage if necessary.
-
Green
Above target
-
Yellow
Approaching threshold
-
Red
Action required
Don't use gradients or complex visualizations. You need instant clarity, not aesthetic appeal.
The real-world setup that works: One agency owner mounted a 27-inch monitor on the wall visible from every desk. Their KPI dashboard stayed open all day. No clicking, no logging in. When numbers shifted, everyone saw it immediately. That visual presence alone improved their response time to threshold breaks.
When KPIs signal operational problems
The real value isn't the numbers themselves—it's recognizing patterns that predict bigger issues.
When quote-to-booking conversion and ABV drop simultaneously, you're likely quoting the wrong trips to the wrong clients. When RevPAH drops while booking error rate rises, you're rushing through complex bookings to handle volume.
A small agency in Portland noticed their CAC creeping from $180 to $310 over four months while their repeat rate stayed flat at 28%. Classic sign of attracting price-shoppers instead of relationship-seekers. They shifted from Google Ads to referral partnerships and brought CAC back to $195 while improving repeat rate to 34%.
Watch for these combinations:
-
Declining ABV + Rising Error Rate = Rushing low-value bookings
-
Falling Conversion + Stable Error Rate = Quote presentation problems
-
Rising CAC + Flat Repeat Rate = Wrong client targeting
-
Longer Payment Collection + High ABV = Insufficient payment structure for premium clients
These patterns tell stories about operational health. Rising CAC with flat repeat rates means marketing to the wrong audience. Declining conversion with stable ABV suggests quote timing issues. Increasing error rates with improving RevPAH indicates cutting corners for speed.
The automation piece that makes tracking effortless
Manual KPI tracking fails because it requires discipline when you're already overwhelmed. The agencies maintaining these metrics successfully have automated the data collection.
Travel agency operational software can pull these numbers automatically from your booking system, payment processor, and email. Instead of updating spreadsheets, you check a live dashboard that flags issues immediately.
A simple workflow for automating KPI collection looks like this:
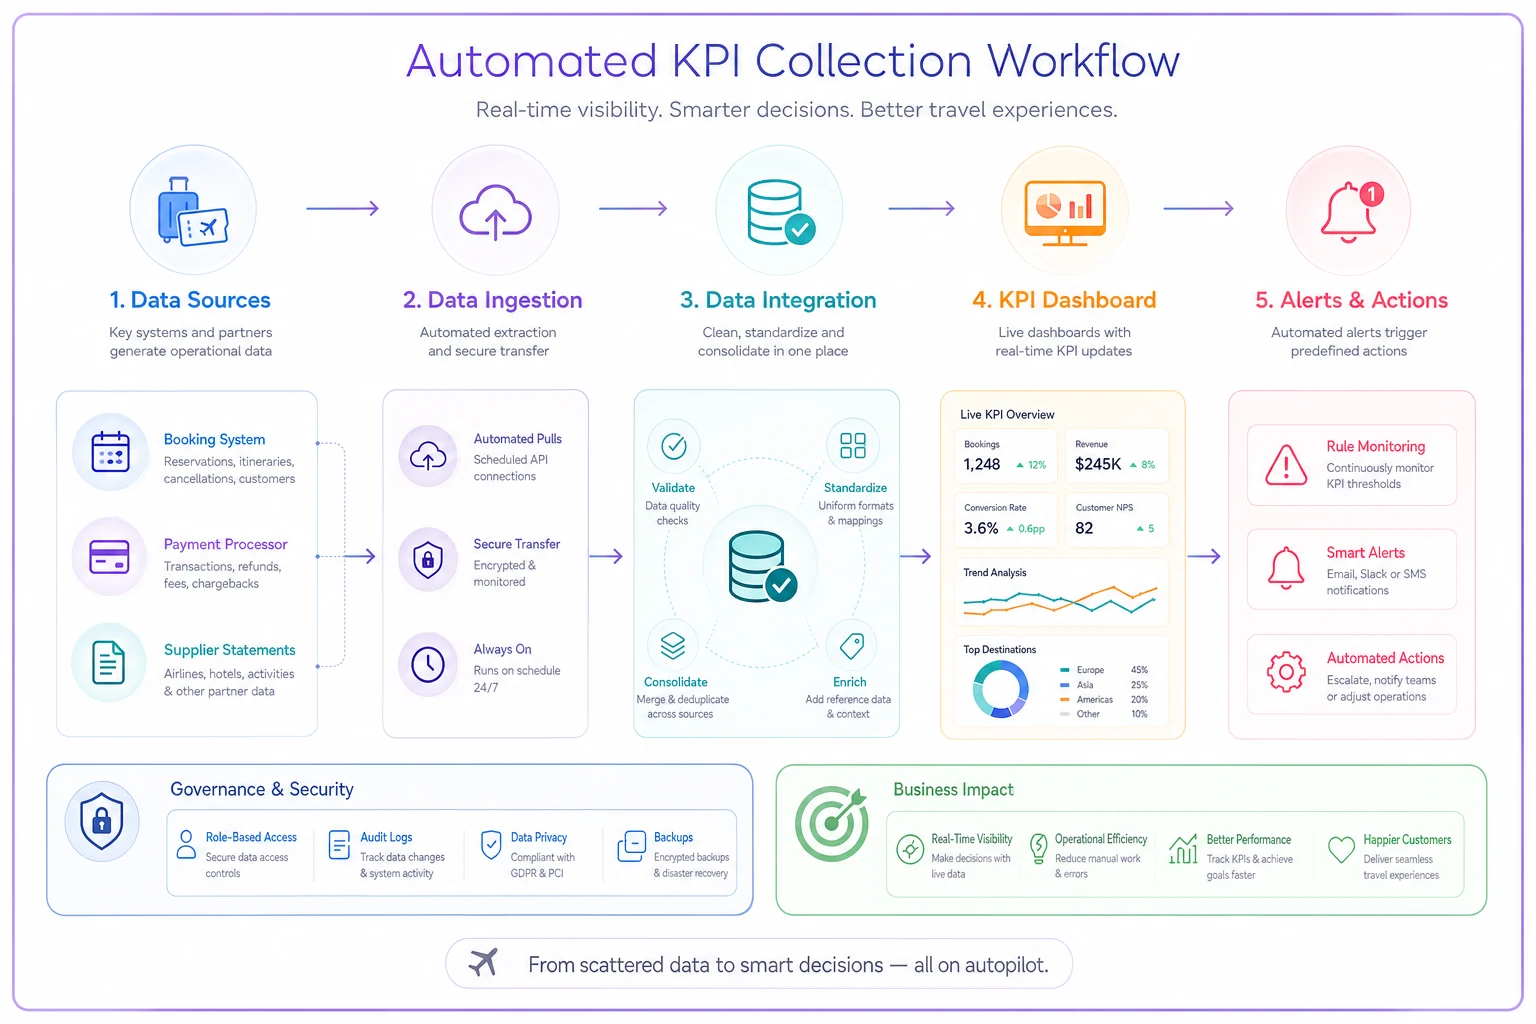
The key is connecting your operational data sources—booking confirmations, payment records, supplier statements—into one system that calculates these KPIs continuously. When a metric crosses a threshold, you get alerted with the specific action to take.
One agency owner switched from manual tracking to automated KPI monitoring and saved 6 hours weekly while improving her response time to operational issues. She caught commission discrepancies within days instead of months. That kind of operational clarity directly impacts the bottom line.
AI-powered workflow automation handles the tedious parts—reconciling supplier statements, tracking payment timelines, calculating error rates from booking modifications. You focus on the strategic responses when thresholds break, not on collecting the data that identifies those breaks.
Avoiding the complexity trap
The temptation with KPIs is always to add more. You'll think "I should also track supplier diversity" or "What about social media engagement?"
Don't.
Start with these eight. Run them for three months. Only after you're consistently hitting your thresholds and taking prescribed actions should you consider adding metrics.
Most travel agencies running $500K-$2M can operate their entire business on these eight KPIs. You don't need enterprise-level analytics. You need clarity on what drives revenue and efficiency, with specific triggers that prompt specific actions.
The agencies struggling with profitability rarely lack data—they lack operational clarity about what that data should trigger. These eight KPIs, with their specific thresholds, provide that clarity.
Your dashboard should drive decisions, not just display data. Every metric should have a clear "if this, then that" response. Otherwise, you're just decorating spreadsheets while your margins slowly erode.
Track what matters. Ignore what doesn't. Take action when thresholds break. That's how small travel agencies maintain healthy operations without drowning in analytics.
Ready to elevate your travel agency workflow?
Join 1,200+ travel agencies using Travexly to save time, improve client satisfaction, and boost operational efficiency.